Consumo anual de cannabis por país
Esta é uma lista do uso anual de cannabis por país por pessoas entre 15-64 anos (ou outras idades indicadas). O indicador de prevalência anual mostra a porcentagem de pessoas que usam a droga por pelo menos uma vez no ano.
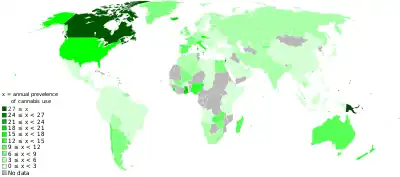
Mapa do uso anual de maconha por país.
A fonte primária é World Drug Report 2006 (WDR 2006)[1], publicada pela Escritório das Nações Unidas sobre Drogas e Crime.
| País ou Etnia | Prevalência anual (%) | Ano | Fontes e notas |
|---|---|---|---|
| 29.5 | 1995 | [1] | |
| 29.1 | 1995 | [1] | |
| 21.5 | 1998 | [1] | |
| 17.7 | 2003 | [1] (Tentative estimates) | |
| 16.8 | 2004 | [1] (15-64) | |
| 16.1 | 2000 | [1] (Tentative estimates) | |
| 16.1 | 1996 | [1] | |
| 13.8 | 2000 | [1] | |
| 13.4 | 2001 | [1] | |
| 13.3 | 2004 | [1] | |
| 12.6 | 2004 | [1] (15-64) | |
| 11.8 | 2002 | [1] | |
| 11.3 | 2003 | [1] | |
| 10.9 | 2002 | [1] (18-64) | |
| 10.8 | 2003/04 | [1] (16-59) | |
| 10.7 | 2001 | [1] (Tentative estimates) | |
| 9.8 | 2002 | [1] | |
| 9.6 | 2003 | [1] (Tentative estimates) | |
| 9.1 | 2004 | [1] (Tentative estimates) | |
| 9.1 | 2003 | [1] | |
| 8.4 | 2002 | [1] (Tentative estimates) | |
| 8 | 2003 | [1] (Tentative estimates) | |
| 7.9 | 2003 | [1] (16-59) | |
| 7.8 | 1995 | [1] (Tentative estimates) | |
| 7.6 | 2003 | [1] (Tentative estimates) | |
| 7.6 | 2003 | [1] (Tentative estimates) | |
| 7.5 | 2004 | [1] | |
| 7.3 | 2002 | [1] (Tentative estimates) | |
| 7.1 | 2003 | [1] (15-54) | |
| 6.9 | 2003 | [1] (18-59) | |
| 6.9 | 2000 | [1] | |
| 6.7 | 2003 | [1] (Tentative estimates) | |
| 6.7 | 2003 | [1] (Tentative estimates) | |
| 6.4 | 2001 | [1] (Tentative estimates) | |
| 6.4 | 2001 | [1] (Tentative estimates) | |
| 6.2 | 2003 | [1] (Tentative estimates) | |
| 6.2 | 2000 | [1] (16-64) | |
| 6.1 | 2001 | [1] | |
| 6 | 1998 | [1] (Tentative estimates) | |
| 5.7 | 2001 | [1] (UNODC estimates) | |
| 5.6 | 2004 | [1] | |
| Northern Ireland (UK) | 5.4 | 2002/03 | [1] |
| 5.2 | 1997 | [1] (UNODC estimates) | |
| 5.1 | 2002/03 | [1] | |
| 5 | 2004 | [1] (12-45) | |
| 5 | 2001 | [1] (18-75) | |
| 4.7 | 2003 | [1] (Tentative estimates) | |
| 4.6 | 2004 | [1] | |
| 4.6 | 2003 | [1] | |
| 4.2 | 2004 | [1] (Tentative estimates) | |
| 4.2 | 2003 | [1] (Tentative estimates) | |
| 4.2 | 2000 | [1] | |
| 4.2 | 1999 | [1] | |
| 4.1 | 2004 | [1] (18-64) | |
| 4.1 | 2003 | [1] (Tentative estimates) | |
| 4 | 2003 | [1] (Tentative estimates) | |
| 4 | 2003 | [1] (Tentative estimates) | |
| 4 | 1994 | [1] (Tentative estimates) | |
| 3.9 | 2004 | [1] | |
| 3.9 | 2003 | [1] (Tentative estimates) | |
| 3.9 | 2003 | [1] | |
| 3.9 | 2000 | [1] | |
| 3.9 | 2000 | [1] (Tentative estimates) | |
| 3.8 | 2003 | [1] (15-68) | |
| 3.7 | 2003 | [1] (Tentative estimates) | |
| 3.6 | 2005 | [1] | |
| 3.6 | 2003 | [1] (Tentative estimates) | |
| 3.5 | 2004 | [1] (Tentative estimates) | |
| 3.5 | 2003 | [1] (Tentative estimates) | |
| 3.5 | 2003 | [1] (Tentative estimates) | |
| 3.4 | 1998 | [1] (Tentative estimates) | |
| 3.3 | 2002 | [1] (Tentative estimates) | |
| 3.3 | 2001 | [1] | |
| 3.3 | 1997 | [1] | |
| 3.2 | 2005 | [1] (12-50) | |
| 3.2 | 2002 | [1] | |
| 3.2 | 2000 | [1] | |
| 3.2 | 1998 | [1] (Tentative estimates) | |
| 3 | 2002 | [1] (Tentative estimates) | |
| 2.9 | 2002 | [1] (Tentative estimates) | |
| 2.8 | 2002 | [1] | |
| 2.8 | 1999 | [1] | |
| 2.6 | 1999 | [1] (Tentative estimates) | |
| 2.6 | 2003 | [1] (Tentative estimates) | |
| 2.6 | 2003 | [1] (Tentative estimates) | |
| 2.6 | 2002 | [1] (Tentative estimates) | |
| 2.5 | 2002 | [1] | |
| 2.2 | 2004 | [1] (18-64) | |
| 2.2 | 2004 | [1] | |
| 2.2 | 2002 | [1] (Tentative estimates) | |
| 2.1 | 1999 | [1] | |
| 2.1 | 2001 | [1] (Tentative estimates) | |
| 2 | 2002 | [1] (Tentative estimates) | |
| 2 | 2002 | [1] (UNODC estimates) | |
| 1.9 | 2004 | [1] (16-65) | |
| 1.9 | 2003 | [1] (18-65) | |
| 1.9 | 2003 | [1] (Tentative estimates) | |
| 1.9 | 2000 | [1] | |
| 1.9 | [1] (UNODC estimates) | ||
| 1.8 | 2004 | [1] | |
| 1.8 | 2002 | [1] (12-64) | |
| 1.7 | 2004 | [1] | |
| 1.6 | 2004 | [1] | |
| 1.6 | 2003 | [1] (Tentative estimates) | |
| 1.6 | 2002 | [1] (Tentative estimates) | |
| 1.5 | 2001 | [1] (13-64) | |
| 1.5 | 2001 | [1] (12-65) | |
| 1.5 | 2000 | [1] | |
| 1.4 | 2001 | [1] (Tentative estimates) | |
| 1.4 | [1] (UNODC estimates) | ||
| 1.3 | 2002 | [1] (15-65) | |
| 1.3 | 2003 | [1] (Tentative estimates) | |
| 1.3 | 2000-2001 | [1] (12-70) | |
| 1 | 2001 | [1] (12-65) | |
| 0.9 | 2004 | [1] | |
| 0.9 | 1995 | [1] | |
| 0.8 | 2001 | [1] (18-65) | |
| 0.7 | 2002 | [1] (Tentative estimates) | |
| 0.5 | 1994 | [1] | |
| 0.5 | 2003 | [1] (12-65) | |
| 0.5 | [1] (UNODC estimates) | ||
| 0.4 | [1] (UNODC estimates) | ||
| 0.3 | 2002 | [1] (Tentative estimates) | |
| 0.2 | 1999 | [1] (UNODC estimates) | |
| 0.2 | 1996 | [1] | |
| 0.1 | 2002 | [1] | |
| 0.1 | 1999 | [1] | |
| 0.1 | 1997 | [1] | |
| 0.1 | 1996 | [1] | |
| 0.05 | 1998 | [1] | |
| 0.02 | 2004 | [1] | |
| 0.02 | 1996 | [1] | |
| 0.004 | 2004 | [1] |
Ligações externas
This article is issued from Wikipedia. The text is licensed under Creative Commons - Attribution - Sharealike. Additional terms may apply for the media files.